Computational Auditory Scene Analysys and Sound Separation
Contents
Multi-channel based Sound Separation
Multi-channel based Sound Separation
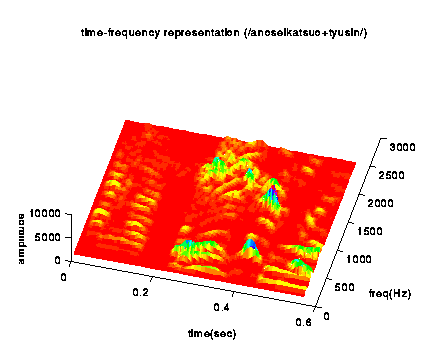
Time-Frequency Representation of Sound
Time-frequency representation of a sound
obtained as the output of a set of band-pass filters.
To match the sensitive level of human,
the level of each frequency band is adjusted by the MAF
(minimum audible field) curve of human.
[Next]
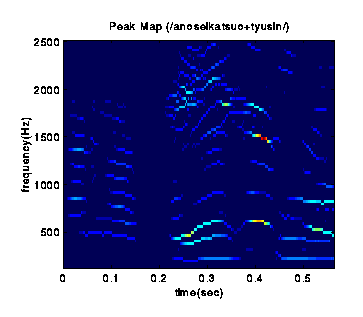
Local Peak Map
[Prev],[Next]
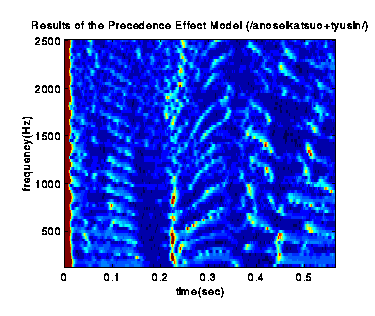
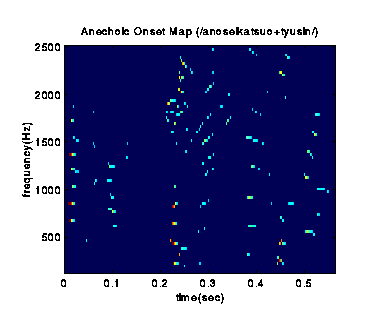
Echo-Free Onset Map based on the Model of the Precedence Effect
A map of estimated sound to echo ratio in time-frequency domain.
Detected echo-free onsets by the model of the precedence effect.
[Prev],[Next]
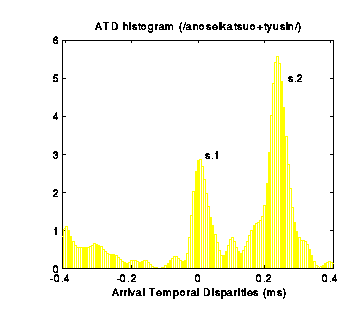
Histogram of Onset ATDs
The Arrival temporal disparity (ATD) of each sound component
(between different channels) is calculated at the onset of component.
A histogram of onset ATD is calculated in which each significant peak
probably corresponds to an existing sound source.
Sound components are then separated according to their assigned groups.
[Prev],[Next]
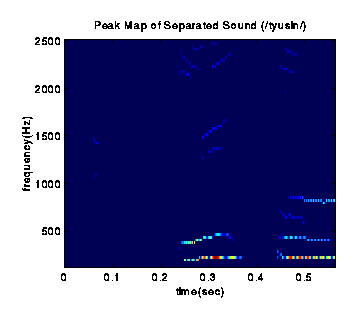
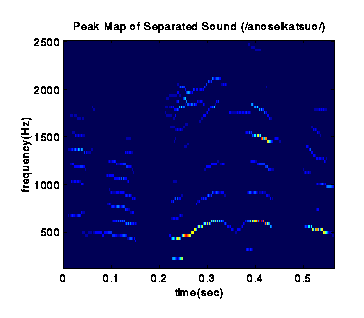
Grouping Components by Onset ATDs
Sound component group 1 (/tyusin/).
Sound component group 2 (/anoseikatsuo/).
[Prev],[Next]
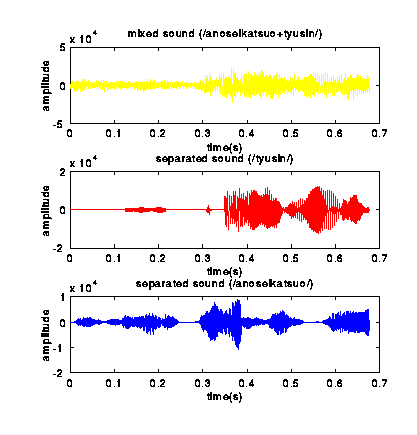
Results of Separation
The following figures show the waveforms of sound
before and after the separation.
(Experiment in an Anechoic Chamber)
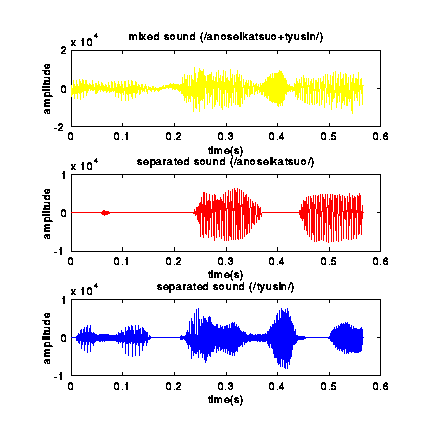
(Experiment in an empty room enclosed with concrete walls)
[Prev]
[Return to home page]
last modified: 19 August 2000 by Jie Huang (j-huang@u-aizu.ac.jp).


