[Home]->[Project]->[Dynamic set diagrams]

[Japanese]

Optimizing Stepwise Animation in Dynamic Set Diagrams

Computer Graphics Forum, Vol. 38, No. 3, 2019


This web page is prepared for providing research materials of our project on optimizing stepwise animation in dynamic set diagrams.


Visualizing dynamic changes in set memberships


A set diagram represents the membership relation among data elements. It is often visualized as secondary information on top of primary information, such as the spatial positions of elements on maps and charts. Visualizing the temporal evolution of such set diagrams as well as their primary features is quite important; however, conventional approaches have only focused on the temporal behavior of the primary features and do not provide an effective means to highlight notable transitions within the set relationships.

In this project, we formulated an animation approach for such dynamic set diagrams to fully elucidate the underlying temporal changes in the set memberships of the data elements. For this purpose, we employed a graph-based representation of a set diagram, which helps decompose the entire temporal transition into atomic changes associated with the data elements for composing stepwise animations automatically. Our technical contribution lies in optimizing the sequence of the atomic changes to reduce the gaze shifts imposed on the viewers and in arranging the depth ordering of sets during the animation to minimize occlusions. In addition, we decrease the duration of the entire transition by clustering conflict-free atomic changes while retaining visual clarity in the animation.

Fig. 1 shows a stepwise animation between two set diagrams generated automatically using our approach. Compared to the simple interpolation on the top (Fig. 1(a)), our approach (Fig. 1(b)) can successfully visualize how the source set diagram changes into the target one while suppressing occlusions among the sets. See the video in Fig. 2 for more details about the idea of this work.

Fig. 1: Side-by-side comparison of the interpolation method between two set diagrams. (a) A simple interpolation in which elements are linearly translated simultaneously. (b) Our optimized stepwise animation in which the transition is decomposed to a sorted sequence of atomic changes. Each element is represented as an image of the alphabet and each set is represented as a colored region.


Fig. 2: Video demonstration for the idea of the proposed stepwise animation for dynamic set diagrams.


Results


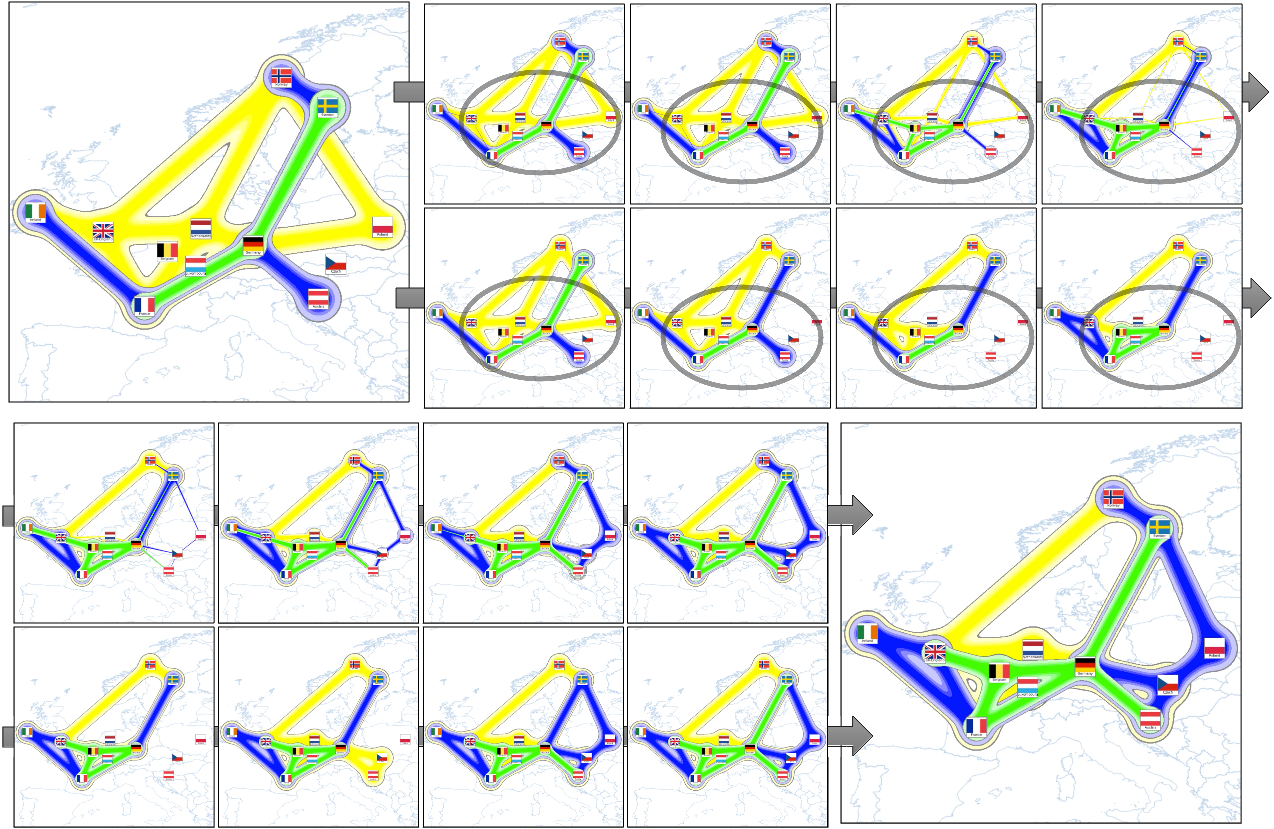
Fig. 3 exhibits the temporal transition of flu spread across Europe on the map. We employed this example to evaluate how our approach can enhance the readability of the dynamic set diagram when the elements are fixed on the map domain. In contrast to simple linear interpolation, we can readily track individual changes in the set membership with our stepwise animation.

Fig. 3: Snapshots of the stepwise animation of the flu dataset.


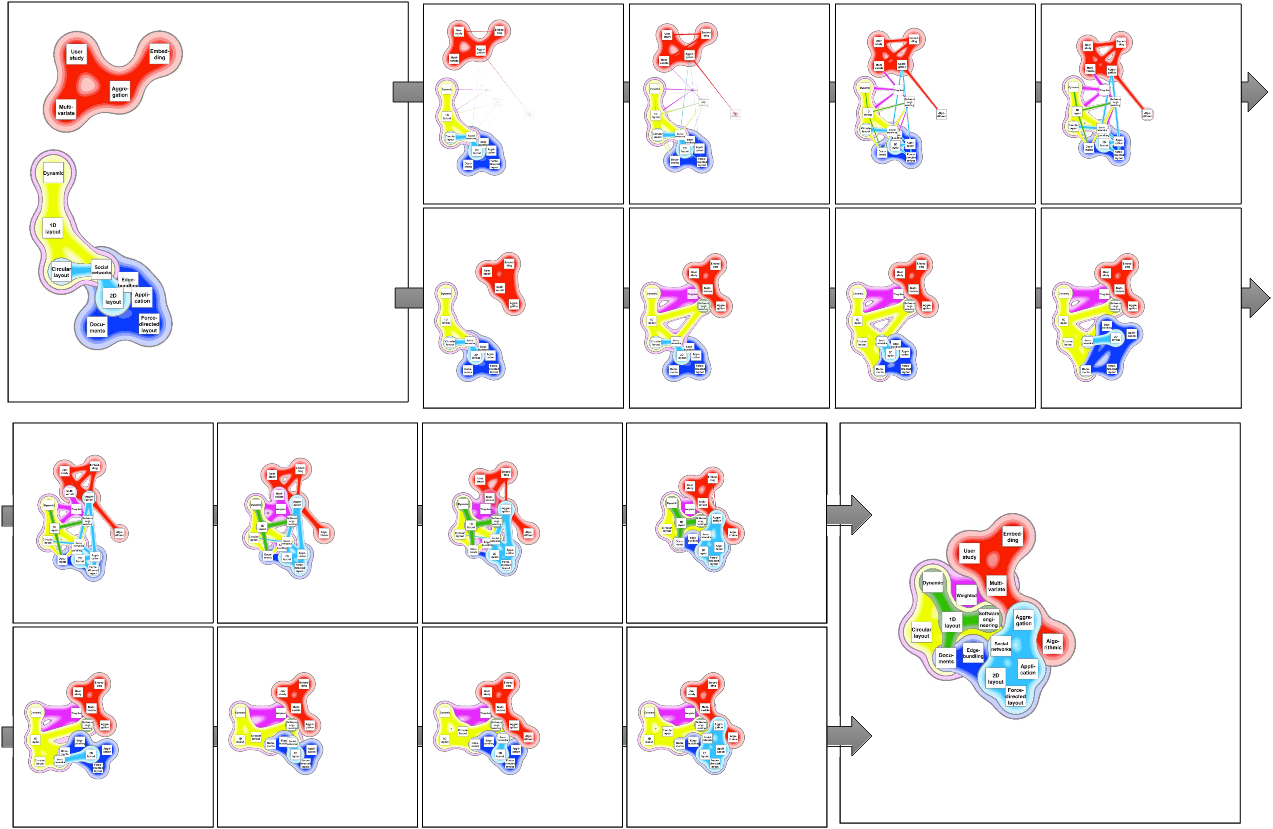
Fig. 4 shows the relationships between researchers and keywords in their publications. In this case, the keyword elements change their positions such that they come together to constitute a researcher set they belong to. The stepwise animation effectively facilitates us to identify the translations or exclusions/inclusions of keywords associated with the expertise of each researcher.

Fig. 4: Snapshots of the stepwise animation of the authorship dataset.


See the video in Fig. 5 also for more details about the results synthesized using our approach.


Fig. 5: Demonstraton animation of our approach


Paper & Video

Kazuyo Mizuno, Hsiang-Yun Wu, Shigeo Takahashi, and Takeo Igarashi,   Optimizing Stepwise Animation in Dynamic Set Diagrams,   Computer Graphics Forum (Proceedings of EuroVis 2019), Vol. 38, No. 3, pp. 13-24, 2019.   [PDF], [Supplementary material:PDF], [DOI: 10.1111/cgf.13668].
Received Honorable Mention in EuroVis 2019. award


email