Selection of Optimal Viewpoints of Object Features
Research Contents
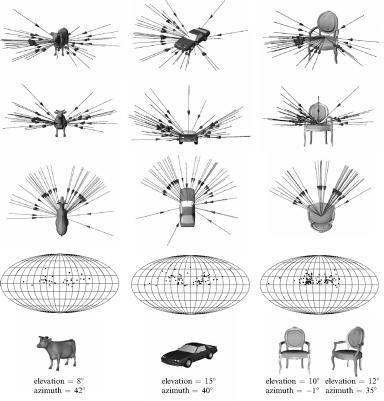
It is common to see 3D information through paper, computer displays and many other different kinds of 2D media. The amount of 3D information which we can communicate largely depends on the selected viewpoints when converting 3D information into 2D information. Although we can create projections from many viewpoints, we think that it is important to obtain information from the most optimal viewpoints, because first impressions have a great influence on humans. In the following picture, according to a psychological experiment of viewpoint selection by V. Blanz (V. Blanz et al. Perception 28(5):575-600, 1999), humans believe that the most optimal viewpoints are the ones that satisfy the following conditions:
- Many important features are included in each projection.
- Stability is preserved if the viewpoint changes slightly.
- Occluded parts are few.
|
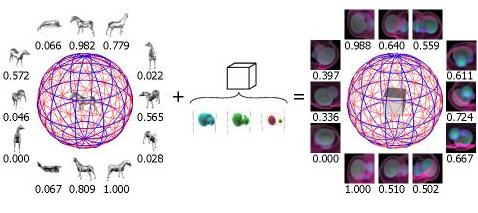
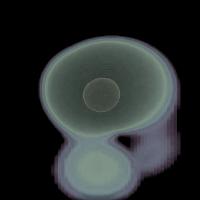
In this research, we have developed a method to apply this knowledge to visualization of volumetric data. In the following picture, we analyze the features of volumetric data (center). Afterwords, we sample viewpoints from the surrounding sphere of the volumetric data and then calculate a score depending on how clearly we can see each feature (left). Finally, by taking the sum of the scores of each feature, we select the most proper viewpoints of the overall structure.
|
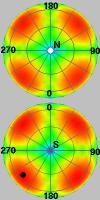
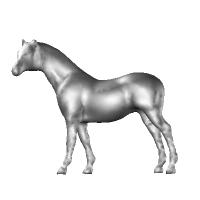
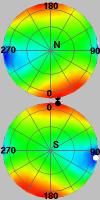
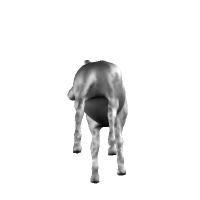
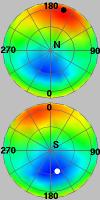
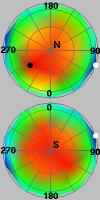
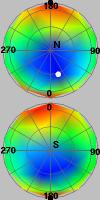
The selection of the optimal viewpoints for each feature is calculated by considering how well we can see the feature as a probability and maximizing its information entropy. For example, for cube and horse models, optimal (left) and worst (right) viewpoints are shown in the following image. In the value distribution of the evaluated viewpoints (center), red color represents a high score and blue represents a low score. In addition, the upper images are shown as seen from the northern hemisphere, while the lower images are seen from the southern hemisphere. In this distribution a white point represents an optimal viewpoint while a black point represents a worst viewpoint.
| Projection from optimal viewpoints | Distribution of the evaluated viewpoints | Projection from worst viewpoints |
|---|---|---|

|
|

|
|
|
|
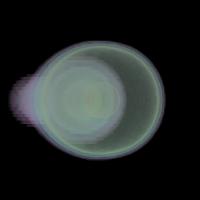
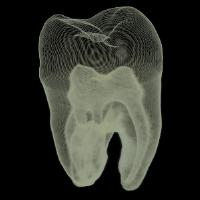
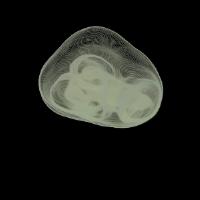
We display some examples of volumetric data to which this method was applied in the following images. As can be seen from the results shown on the images below, visually plausible optimal viewpoints have been calculated from the internal structure of the volumetric data.
| Projection from optimal viewpoints | Distribution of the evaluated viewpoints | Projection from worst viewpoints |
|---|---|---|
|
|
|
|
|
|
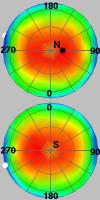
In order to prove the efficiency of this technique we perform a test on users. Specifically, users see the visualized volumetric data from various viewpoints and evaluate them. Then we compare the distribution of the users' results with the one from our method. The results are shown in the following images. As we can see, both distributions are very similar, and from this results we can conclude that our method is efficient enough.
|
|
|
|
|
|
Proposed method |
User evaluation |
Proposed method |
User evaluation |
|
Simulation data of a hydrogen proton collision |
CT data of a tooth | ||
Reference Materials
|
Video of the presentation in IEEE Visualization 2005 [WMV] |
Reference Literature
- S. Takahashi, I. Fujishiro, Y. Takeshima, and T. Nishita: "A Feature-Driven Approach to Locating Optimal Viewpoints for Volume Visualization," in Proc. of IEEE Visualization 2005, (at Minneapolis, MN, USA), IEEE Computer Society Press, pp. 495--502, October, 2005. [PDF]